Corporate Social Responsibilities (CSR) or 1 + 1 = 3

At the 2020 World Economic Forum held between 20-23 January 2020 in the mountain town of Davos, governments, organisations (both for profit and not-for-profit) and individuals discussed how they can better deliver the United Nations Sustainable Development Goals (SDGs).  Central to this discussion was how innovative partnerships (i.e. commercial relationships) could help achieve this, especially within the public sector.  But why is the focus on public sector so important?

Supporting this discussion, The Economist Intelligence Unit (EIU) supported by UNOPS (the UN organisation with a core mandate for infrastructure and procurement) released a new report “The future of public spending: Why the way we spend is critical to the Sustainable Development Goals”.  The report investigates the potential for less wasteful, more efficient government spending practices to help address a critical spending gap that countries face in achieving the Sustainable Development Goals, and how social, environmental and economic sustainability objectives can be achieved through procurement.  This report highlighted that:

“Public spending has an extremely large footprint, typically representing 15-30% of GDP. Which projects governments choose to spend money on—and who they spend it with—therefore makes a substantive difference. Rather than being “neutral”, such spending will positively or negatively impact everything from local employment to levels of carbon emissions, making public spending integral to many of the SDGs.”

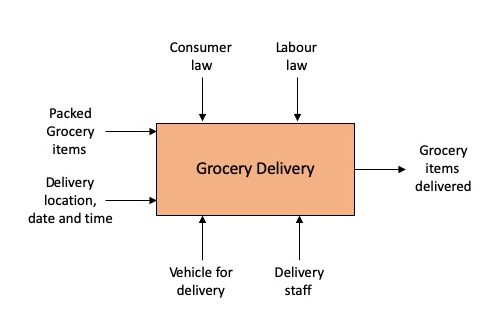
Here in Australia, the Commonwealth Procurement Rules (CPRs) requires all Commonwealth entities to publish a range of procurement information on AusTender, the Commonwealth Government’s mandated procurement information.  My former organisation, the Australian Department of Defence, between July 2018 and June 2019 was responsible for 67% of all procurements listed on AusTender, or $43.178 Billion Australian Dollars (see Department of Finance).  This proportion (not value) would be similar in many countries.  The key question is whether we can use this funding to achieve more than the original contract requirement(s).  Is it possible to achieve both the project requirements while also delivering wider community benefits?

In considering this, many of you, regardless of whether buyer or seller, will be asking the impact of this approach on the overall price.  Will it cost more?  While there is anecdotal evidence to say there typically is a slight increase in the overall price to the buyer, the question is not whether this approach represents the lowest price.  It never will.  But whether it represents the best Value for Money (VfM) in the long-term, and not only to the specific area undertaking the procurement activity, but also the wider department and community.  Indeed, the reason for the focus on the public sector at Davos is that many governments have recently included this additional requirement is their procurement rules.  For example, the CPRs states:

4.5       Price is not the sole factor when assessing value for money. When conducting a procurement, an official must consider the relevant financial and non-financial costs and benefits of each submission including, but not limited to:

  • the quality of the goods and services;

  • fitness for purpose of the proposal;

  • the potential supplier’s relevant experience and performance history;

  • flexibility of the proposal (including innovation and adaptability over the lifecycle of the procurement);

  • environmental sustainability of the proposed goods and services (such as energy efficiency, environmental impact and use of recycled products); and

  • whole-of-life costs.

Additionally, a recent change to the CPRs states that for “for procurements above $4 million (or $7.5 million for construction services) (except procurements covered by Appendix A and procurements from standing offers), officials are required to consider the economic benefit of the procurement to the Australian economy.”

But why am I bringing this up in a Performance Based Contracting forum?

A good Performance Based Contracting approach can support the implementation of these wider procurement objectives.  As one of my favourite quotes goes:

“What gets measured gets done, what gets measured and fed back gets done well, and what gets rewarded gets repeated.”

John E. Jones

By using the Generation 3 Performance Based Contracting techniques I have illustrated in this blog including:

it is possible to achieve this.

For example, a client in Europe recently included performance measures called Enterprise Performance Measures (EPMs) reflecting the performance of the wider “enterprise” compared with the performance of one seller in a single contract.  The EPMs are not solely focused on the core output of the contract, but also on wider Corporate Social Responsibilities such as the impact on the environment (e.g. minimisation of landfill and carbon targets) to building a better community (e.g. collaboration, engagement and treatment of small-medium businesses within the supply chain, and the implementation of a Science, Technology, Engineering and Maths (STEM) program in local schools).  So it is possible, just not typical.

Some of you may be thinking that organisations, especially for profit organisations are only doing this in response to the “nudge” from the buyer.  And in some ways that is true.  A former top executive within the Australian Department of Defence once said, referring to his for profit contractors, that “what interests me should fascinate them”.  By this he meant if we (the buyer) focused on these wider outcome it would cause the sellers to also take an interest in delivering them.  However, and it may surprise many readers, some these organisations already do a range of community minded activities without the “nudge”.  For example, one large multi-national organisation as part of an annual “day of service” allows employees to volunteer in areas of need in their local communities (e.g. aged care, home repairs, supplying meals and many other forms of assistance) as a paid day of work.

The sceptical amongst you will be thinking that this behaviour is only to gain favour with the public sector procurement officer, and there is an element of truth to this.  However, these organisations are all made up of individuals with families in the communities where they work who also believe in the ideals in the Sustainable Development Goals.  These individuals help make this a priority for the organisation, not simply to gain favour, but because it is important to the people within it.

So the question I leave with each of you, regardless whether buyer or seller, is not why should we; but why shouldn’t we.  Image what could happen if we allowed these large commercial relationships to deliver, even if only partly, on these wider outcomes.  I believe that many of us want this not just for ourselves and our families, but also for the wider community.  The question is simply how do we do it leveraging the great work may organisations and individuals are already doing.  But more on this in a later article.

Posted in Corporate Social Responsibility, Outcome, outcomes, the How, the Why | Tagged , , , , , , , , , , , , , | Leave a comment

Welcome to 2020!

For those interested in the topic of Performance Based Contracting (PBC) I wanted to provide my plans for the blog for 2020.

Firstly and most excitingly, in early February 2020 I will be releasing my first “podcast”.  This is a 45-minute introduction to Performance Based Contracting providing time poor readers a quick and simple way of getting to know the topic and the key features.  The only concern will be having to suffer my Australian accent; but hopefully it isn’t too bad for most of you!  From there, every two months I plan to release a new podcast looking in more depth at a particularly interesting topic within the field of Performance Based Contracting.

In addition to the podcast I will continue to release a number of articles on key topics.  Specifically, I intend to examine the following:

  1. Net Promoter Score performance measure
  2. Power-by-the-hour approaches
  3. Customer Experience (CX) approaches
  4. Applying the Information Pyramid to Performance Based Contracting
  5. Designing highly successful qualitative / subjective performance measures

Finally, together with some friends, I will continue to contribute articles to the Collaborative Contracting blog.

Of course if there is anything that you want me to specifically cover please don’t hesitate to ask as I am always keen to help people in their Performance Based Contracting journey and add to the wider community of practice.

Posted in Admin, Holiday Message | Tagged , , , , | Leave a comment

Happy 2019 Holidays to all the Performance Based Contracting (PBC) Blog Readers

To all my readers, while I hope you’ve enjoyed the content over the past 12 months, I hope each of you have an opportunity to have a break and a bit of downtime over the next few weeks.

At this joyous time of year, I am always grateful for the time I can spend with my friends and family, and I wish you all abundance, happiness, and peace in a New Year filled with hope.

Happy holidays!

Best Wishes
Andrew Jacopino

Posted in Admin | Tagged , , , , | 1 Comment

Supply Chain Performance Measures

“There is an immeasurable distance between late and too late.”

Og Mandino

While driving to work the other day I listened to a discussion on the longest time listeners had waited for a parcel to arrive.  One caller said they were still waiting for their purchase from almost a year ago, to which the response from the radio hosts was “. . . looks like you waiting for a Christmas present . . . from 2018!”.

Given the festive season is almost upon us it got me thinking of one misunderstanding of single supply chain performance measures used by many delivery organisations to show us (the customer) how reliable they are in delivering their goods within the guaranteed delivery times.  One such performance measure is DIFOT, or Delivered In-Full, On-Time.  DIFOT is a relative measure in percentage, of the number of orders successfully delivered “in-full” (where there is more than 1 item) and “on-time” (based on the agreed delivery date at the time of purchase).

DIFOT is simple to use and easy to understand.  But what about our unfortunate caller whose order was not delivered in-full and on-time?  How do we track the performance of “failed” deliveries; that is deliveries that were not delivered?  Moreover, what if the only commercial consequence for the seller was DIFOT?  Is there any incentive for them to complete the late order?  While many of you may be thinking this is a negative opinion of many seller’s who want to ensure customer satisfaction, consider the following.

In 2017 Amazon shared some data on its Prime delivery services focused on two-day delivery with more than 5 billion items shipped worldwide with the two-day Prime delivery service.  So even if DIFOT was 99.9999% only for the Prime two-day delivery service this means that 5,000 deliveries we not delivered in full, on-time.  But what happens to these “failed deliveries”?  How to we track, and potentially incentivise, the delivery of these late orders?

One option is to include another performance measure representing the seller’s performance in quickly delivering the “failed deliveries”.  One such performance measure is Average Days Late which represents the average number of days for all failed deliveries after the agreed delivery date / time that customers are waiting for their late order.

Looking at the scenario below we can see that the majority of the deliveries were delivered in-full and on-time, and are captured by the first Key Performance Indicator (KPI).  However, there was one delivery that was not.  In this instance, the second KPI then addresses this failed delivery.  So combining the 2 performance measures, DIFOT and Average Days Late, results in a more accurate and representative picture of delivery performance compared to just DIFOT.

Figure 1 : Interaction between Supply Chain Performance Measures

The key takeaway here is that single performance measures typically do not accurately represent performance (see previous article, The Allure of a Single Measure).  Therefore, in designing our Performance Management Framework (PMF) we should ensure measurement of not only success, but also failure.  Since at the adage goes, “plan for failure, but hope for success”, although this festive season I hope all your wishes are delivered in-full and on-time!

Posted in Performance Measure, the How | Tagged , , , , , , , , , , , | Leave a comment

Collaborative Contracting . . . the blog

It seems that collaboration is everywhere nowadays.  Whether it is Ed Sheeran and Justin Bieber producing a number 1 single, designer Tommy Hilfiger and Formula 1 driver Lewis Hamilton delivering exclusive clothing lines to Apple putting CarPlay into a variety of cars.  Everyone seems to be doing collaborations, even businesses.  But are they all successful?  And if so, were they successful due to chance, a heroic individual, or by careful design?  And can we learn from this?

Given the relevance of collaboration to all us, both buyer and seller alike, a few of my colleagues (Jim Bergman, John Davies, Michael Frith and Greg Laxton) and I have started another blog, Collaborative Contracting, to try and help demystify this topic and provide practical, implementable solutions.  Importantly, this blog is not about marketing you a paid service or training course, getting a high page ranking or collecting email addresses for on-selling, and this includes comments (see the comments section below for rules on comments).  Instead, we are trying to create a not-for-profit Collaborative Contracting Community of Practice (CoP) to help socialise and advance this interesting and relevant commercial field.

While I will continue to write my PBC Blog (sorry!), you’ll also find me writing for Collaborative Contracting blog as well.  I hope to see you there in the future to learn and discuss this fascinating and evolving topic.

Posted in Collaboration, Collaborative Contracting | Tagged , , , , , , , , , , , | Leave a comment

Inputs, Output and Outcomes – Part 2

In the previous article (see Inputs, Output and Outcomes – Part 1) I looked at the difference between inputs, outcome and outcomes from a Performance Based Contracting (PBC) perspective in order to highlight the benefits and pitfalls of this approach.  However, we didn’t look at how you could response to this challenge by aligning both collective and individual requirements (i.e. the performance measures) with specific rewards and remedies (i.e. the consequences).

Acknowledging the difference in 2012, the Australian Department of Defence created three tiers of performance measures to reflect input, outputs and outcomes with the later named Strategic Performance Measure (SPMs).  Each of the tiers of performance measures are linked to different levels of commercial rewards and remedies reflecting this concept of input, outputs and outcomes.  Figure 1 highlights the relationship among each of these with the definitions provided in Table 1.

Performance Measure Tiers

Figure 1 : Performance Measure Tiers

Item Definition Commercial Consequences
Strategic Performance Measure (SPM)

OUTCOME

Performance measures that reflect “enterprise” (end customer) outcomes; that is, the highest-level outcome acknowledging that the seller may not be solely accountable for failure or success of this outcome. Given the indirect nature of SPMs, they are typically not linked to money, but rather to other non-monetary rewards and remedies.
Key Performance Indicator (KPI)

OUTPUT

Performance measures that are directly related to seller performance against their individual scope of work where they have sole accountability; outputs. Given the direct linkage of a KPI to Contractor performance KPIs are linked to money resulting in them being quantitative and lag in nature.
System Health Indicator (SHI)

INPUTS

Performance measures that give insight into past and future seller performance by highlighting drivers and constraints to this performance.

Typically, the role of a SHI is to provide confidence in the delivery of the KPIs.

Given the indirect nature of SPMs, they are typically not linked to money, but rather to other non-monetary rewards and remedies

Table 1: Definition of Tiers of Performance Measures

Solution:  Both buyers and sellers need to acknowledge the difference between inputs, outputs and outcomes to ensure the expectations and commercial models are aligned.  It is critical that everyone fully understands the differences in their roles and responsibilities.  However, many organizations, similar to our online grocery delivery example, find it difficult to accept the consequences of holding organizations accountable for a shared, end customer outcome as opposed to individual output.  This is especially true when commercial remedies are involved such as reduced payment or service contracts.  The key is for both buyers and sellers to align their understanding and expectations of their individual contract output with that of the end customer (enterprise) outcome, and how and when the various commercial consequences apply.  Specifically, this includes:

  • what the seller is directly accountable for (e.g. outputs),
  • what shared responsibility all organizations have when delivering outcomes; and
  • aligning the commercial consequences, both positively (rewards) and negatively (remedies) with these different tiers of performance measures.

Our ever increasingly complex, interwoven commercial relationships and supply chains require more clarity of what success looks like and to whom.  Moreover, as stated earlier, although the move to outcomes is laudable, both buyers and sellers need to acknowledge the difference between inputs, outputs and outcomes to ensure the expectations and commercial models are aligned.

So, when next confronted with an “outcomes based contract” asked yourself whether the contract is asking for inputs, outputs or outcomes, and whether the commercial rewards and remedies align with them.  If not, we just may get oranges instead of apples; and who’s fault would that be?

Posted in Contract Consequences, Outcome, outcomes, Performance Measure, the How, the What, the Why | Tagged , , , , , | 1 Comment

Inputs, Output and Outcomes – Part 1

Much has been said about outcomes recently.  Indeed, many buyers seek to use Performance Based Contracts (PBCs) to contract for outcomes, because they are attracted by the simplicity of using a PBC.  But this could be a costly mistake if you do not first carefully plan, set up and execute the requirements of your PBC.

Planning and correctly executing starts with defining what result, or outcome, you desire then evaluating the performance measures defined in the PBC specifically relating to input, outputs, and outcomes.

A PBC – being different from a conventional contract – is designed to reduce overall costs for buyers and provide profitable growth opportunities for sellers.  We tend to view the PBC as the contract model of choice across a range of market sectors.  The ability of organizations to effectively develop, implement and manage PBCs is critical to business success, because failure can often lead to long-term performance, financial and reputational damage.

The following two-part article explains how PBC contracting works and why focusing only on outcomes only is a mistake.  Why is it critical for buyers and sellers to first identify and understand all inputs and outputs?  Only then can they better define the overall outcome (success) as seen by the end customer.

The first step is to clarify whose outcome — the direct outcome of the trading (or partnering) relationship or the outcome as experienced by the final customer.  Will your idea of a successful outcome vary with a change in perspective between – or among – various trading relationships?

To illustrate how an outcomes varies depending on your perspective picture your grocery store’s online ordering system.  You select, order and have delivered a range of grocery items like fruits and vegetables.

Delivering your order requires a number of organisations each with individual roles and responsibilities, and a specific sequence as follows:

  • Step 1 – End Customer (you) selecting groceries, defining the delivery date; paying the bill; and being home for the delivery.
  • Step 2 – Information technology organisation ensuring the grocery ordering website, including the payment system, is available for the end customer, supermarket staff and transportation staff to document orders and deliveries.
  • Step 3 – Grocery suppliers like farmers suppling all types of groceries to the supermarket based on the orders being placed to ensure there is sufficient stock available.
  • Step 4 – Supermarket selecting the items you order online and loading them into containers for delivery. It’s ready to go!
  • Step 5 – Transportation organisation taking groceries from the supermarket and delivering them to you.

Figure 1 shows the variety of organisation and their specific roles and responsibilities involved in delivering your order, in good condition, for the correct price at the agreed date / time, to you as the end customer.

Grocery Home Delivery Enterprise

Figure 1 : Grocery Home Delivery Enterprise

As figure 1 illustrates, the process can be complicated, because many commercial organizations who are expected to get the groceries to you on time are not solely accountable for final success of that delivery to you the end customer.  So, if you are contracting out the grocery transportation process, what is their outcome?  Is it simply successfully delivering all groceries provided by the previous step, the Supermarket, in full and on-time without breakage?  Or is it the end customer satisfaction, which may also depend on the farmers or the IT organisation?  Which I right?

One method we use to help understand this difference in perspective is by describing the inputs and outcome to an individual organization, and then comparing to the end customer outcome.  Here I use inputs and outputs to reflect the lower level organisation or process activities that as a total then make up the end customer outcome.  Indeed, how all these inputs and outputs fit together to deliver the end customer outcome highlights the various interdependencies between the organisations.

One technique to help identify the relationship between inputs and outputs is to use consider using the Integration Definition for Function Modelling (IDEF0).  Figure 2 describes a standard functional process block including four elements: inputs, output, mechanism (resource) and control.

Integration Definition for Function Modelling (IDEF0) Functional Process Block

Figure 2 : Integration Definition for Function Modelling (IDEF0) Functional Process Block

Like other modelling approaches and tools the intent of IDEF0 is to provide a structured representation of the functions, activities or processes within the modelled system or subject area.  Using the IDEF0 model, we can quickly identify whether we are measuring an input (something that enters the process) or an output (something that exits the process).

Let’s consider our grocery example again, and specifically the transportation organisation, which in this case we will contract out.  Here, Figure 3 describes the input and outputs.

IDEF0 Functional Process Block Representation of Online Grocery Delivery Contract

Figure 3 : IDEF0 Functional Process Block Representation of Online Grocery Delivery Contract

NOTE:  Figures 2 and 3 correlate:  Consumer law and Labour law represent Control; Packed grocery items and delivery represent input; Vehicle for delivery and delivery staff represent Mechanism (resource) and Grocery delivery is the outcome.

However, where is the outcome?  More importantly, can the transportation contractor be held solely accountable for an end customer outcome?  For example, if the Supermarket accidently packs oranges instead of apples, and these are delivered, who is at fault?  All will agree that the end customer outcome has not been achieved, but where is the fault?  Importantly, how do we treat this where there are commercial consequences, such as reduction in payment?

In the next article I will talk about one organisation’s response to this challenge by aligning both collective and individual requirements (i.e. the performance measures) with specific rewards and remedies (i.e. the consequences).  In the interim, I look forward to hearing your thoughts on this very interesting topic.

Posted in Contract Consequences, outcomes, Performance Measure, the How, the What, the Why | Tagged , , , , , , | 2 Comments

The Mathematics of a Performance Based Contract (PBC) – Part 2

In the previous article (see The Mathematics of a Performance Based Contract (PBC) – Part 1) I described how a standard Australian Department of Defence Non-Linear PBC Payment Curve could be described by 2 equations for straights lines of the form:

y = mx + b

Accordingly, from a PBC perspective this equation can be rewritten as:

APS = m (Achieved Performance) + Minimum APS Value

The hardest calculation is to determine ‘m’, the slope of the curve.  However, we can simply think of it as “if my Achieved Performance increases by say 1 percentage, how much does the APS go up by?”  In mathematics this is typically written up as:

where:

  • Rise = change in the APS over the length of the line
  • Run = change in the Achieved Performance over the length of the line

Again, if you are a little rusty, you may want to have a look at the following website (see https://www.mathsisfun.com/gradient.html).

Consider the example in Figure 2.

Example Non-Linear PBC Payment CurveFigure 2 – Example Non-Linear PBC Payment Curve

For Performance Band C the gradient would be:

That is, for each 1% increase in the Achieved Performance score from 85% to 90%, the APS would increase by 16%, from 0% to 80%.

Alternatively, for Performance Band B the gradient would be:

That is, for each 1% increase in the Achieved Performance score from 90% to 95%, the APS would increase by 4%, from 80% to 100%.

So why have I done all this maths?  What is the point?

In operation, say the seller achieved an Achieved Performance score of 87%, what would be the corresponding APS?  In this case, using the equation we derived above for Performance Band C we can simply put in the value of 87% as follows:

APS (Performance Band C) = 16 x (APS – 85%) + 0%

= 16 x ( 87% – 85%) + 0%

= 16 x (3%) + 0% = 48%

Therefore, an Achieved Performance score of 87% is equal to an APS of 48%.

Importantly, you will notice an additional term in the equation above, specifically (APS – 85%). The reason for this is to have the same ‘range’, or distance, that the ‘run’ had in calculating the gradient; that is between 85% and 90%.  Therefore, we need to subtract 85% from the Achieved Performance score before multiplying by the gradient.

Alternatively, say the seller achieved an Achieved Performance score of 94%, what would be the corresponding APS?  In this case, using the equation we derived above for Performance Band B we can simply put in the value of 87% as follows:

APS (Performance Band B) = 4 x (APS – 90%) + 80%

= 4 x ( 94% – 90%) + 80%

= 4 x (4%) + 80%

= 16% + 80% = 96%

Therefore, an Achieved Performance score of 94% is equal to an APS of 96%.

Again, you will notice the additional term in the equation above, specifically (APS – 90%) giving the same ‘range’, or distance, that the ‘run’ had in calculating the gradient; that is between 90% and 95%.  Therefore, we need to subtract 90% from the Achieved Performance score before multiplying by the gradient.  However, in this circumstance, the APS had a starting value of 80% and therefore we had to add 80% to the final score.

By being able to do this maths both buyer and seller can determine the APS for each performance measure, and in some cases, determine the payment.  Accordingly, it is important for PBC practitioners, regardless of whether buyer or seller, to be able to understand and complete these calculations.

In the next article we’ll look at an alternate option to using this maths.

Posted in Basis of Payment, Consequence Analysis, Contract Management, payment curve, the How | Tagged , , , , , | Leave a comment

How to Successfully Manage a Performance Based Contract (PBC) – the Prequel

I get many questions from readers of the blog on how to successfully manage a Performance Based Contract (PBC) including what are the critical areas that they need to be aware of.

While many of my posts including discussion points on how to undertake contract management, like the recent one of PBC Mathematics, as an International Association for Contract and Commercial Management (IACCM) Fellow I have in the past provided a guest lecture (webinar) specifically on how to successfully contract manage a PBC as part of their free online Contract Management Course.

If you were not aware, IACCM is again offering this free online Contract Management Course to everyone. The course was developed by IACCM in partnership with the University of Southampton, the UK Cabinet Office and Civil Service Learning.  The course is run over a 3 week period starting on 7 October 2019.

You can get more detail at https://www.iaccm.com/events/register/?id=3511.  You may even see me there!

That said, I will be releasing an article on this topic before the end of the calendar year.

Disclosure – I am an IACCM Fellow and part of the Australia and New Zealand Advisory Board for IACCM.

Posted in Contract Management, IACCM, PBC Training, the How | Tagged , , , , , , | Leave a comment

The Mathematics of a Performance Based Contract (PBC) – Part 1

Over the 15 years of applying and teaching Performance Based Contracting (PBC) I have always had trouble trying to describe the mathematics of PBCs, especially to those who

Reminded by my family’s current viewing of the US TV Series, Numbers, I am inspired to try and make PBC mathematics more accessible in order for non-mathy people to better understand, and hopefully use, these techniques.  So where is maths used in a PBC?  Interestingly, it is used throughout a PBC, from the performance levels to the percentage weighting of each of the say three Key Performance Indicators (KPIs) (e.g. 50% for KPI-1, 30% for KPI-2 and 20% for KPI-3) through to adjustment of the performance fee / At-Risk Amount.  However, for the majority of circumstances, the math in these instances is fairly simple and doesn’t tend to worry most people.  But there are two areas where this isn’t the case:

  1. working out the Adjusted Performance Score (APS) from an Achieved Performance score for a non-linear payment curve; and
  2. using historical data to set a performance level.

In these instances while the maths is fairly simple, they tend to confuse people leading to either avoidance by using an alternate approach which doesn’t require the same level of mathematical ability or removal altogether.  So let’s look at each in turn starting with the Adjusted Performance Score calculation.

Calculating the Adjusted Performance Score (APS) in a Performance Based Contract

In a series of previous articles (see Payment Curves Part 1, Part 2 and Part 3) I highlight the various methods for describing how to turn an Achieved Performance score (i.e. the raw score of the performance measure such as number of days late from a milestone, percentage of satisfied deliveries, number of outages per 1,000 operating hours, etc.) into an APS, which is always a percentage.  While there are a number of ways of doing this, a common method is to use a straight line between the minimum performance level (at which APS = 0%) and the required performance level (at which APS = 100%).  This can be a simple straight line between these 2 points, or as in the Australian Department of Defence approach, this line is broken into 2 segments with an inflection / elbow point making it two lines. However, the issue remains the same, how do I calculate the APS from the Achieved Performance score based on the straight line?

Consider the generic non-linear Payment Curve described in Figure 1 which has four “bands” of performance.

Generic Non-Linear PBC Payment CurveFigure 1 – Generic Non-Linear PBC Payment Curve

Here, all but Band D has a requirement to do some maths in order to determine the APS from the Achieved Performance level using the equation for a straight line:

y = mx + b

where:

  • y = Adjusted Performance Score (APS), or the vertical axis of the payment curve in percentage
  • m = gradient of slope of the line – the lower the value of m the less steep the line, while a higher value of m results in a steeper line
  • x = Achieved Performance score, or the horizontal axis, in whatever scale (e.g. percentage of satisfied deliveries)
  • b = starting or ‘offset’ point which is the value for y when x = 0 (e.g. for Band B the minimum APS is 80%, therefore z = 80%)

If you are a bit rusty you can get more information from the following website (see https://www.mathsisfun.com/equation_of_line.html).

In the next article I will look at how we apply this to a PBC using an example from the standard Australian Department of Defence Non-Linear PBC Payment Curve.

Posted in Consequence Analysis, payment curve, Performance Measure, the How | Tagged , , , , , , , | 2 Comments