
In a previous post we looked at the common types of Payment Curves used in a Performance Based Contract (PBC). These were the All or None Payment Curves, Linear Payment Curves and the Non-Linear Payment Curves. In this post we are going to look at the more uncommon types of Payment Curves, or what my colleagues and I call the Alternative Payment Curves, including Demerit Point and Visual Payment Curves.
While not strictly a Payment Curve, the Demerit Point approach measures the total number of Demerit Points incurred during a Review Period and modifies Contractor Payment based on a performance assessment of each event. Where the event experiences reduced performance or non-performance, Demerit Points are awarded based on how significant/important the event is. For example, Table 1 highlights one approach to awarding the number of demerit points based on how significant/important the event is:

Table 1: Demerit Point Evaluation
The total amount of Demerit Points incurred for all events in the Review Period is then used to calculate the payment. Figure 1 illustrates the corresponding Demerit Point Payment Curve for Table 1:
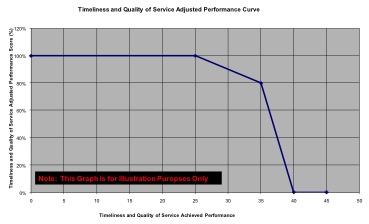
Figure 1: Demerit Point Payment Curve
If used appropriately, Demerit Point payment curves are very efficient when measuring contractor responsiveness to a variety of demands (e.g. urgent and routine) within the same performance measure.
Alternate Payment Curves – Visual
Unlike the other Payment Curves, the Visual Payment Method uses visual indicators (e.g. ‘dots’) to register satisfaction. This includes partial, of softer subjective measures such as customer satisfaction, quality of a meal, etc. This approach can combine many outcomes by using a number of ‘dots’. For example, increasing the number of ‘dots’ against a specific performance measure (e.g. quality of meal) highlights the relative importance of the area to the contractor. To calculate the APS as a percentage, compare the total number of ‘dots’ against the possible total of ‘dots’. Figure 2 illustrates a Visual Payment Curve:
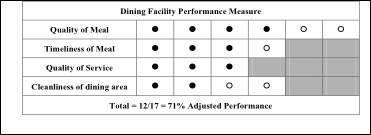
Figure 2: Visual Payment Curve

Pingback: The Mathematics of a Performance Based Contract (PBC) – Part 1 | Performance Based Contracting (PBC) Blog